Method of Particle-size Evaluation of Ground Material
May 31, 2018|Report
By measuring the particle size of a sample before and after grinding using a particle-size distribution analyzer, the extent to which the sample has been crushed can be confirmed. There are several types of particle-size distribution analyzers. The company adopts the “laser diffraction and scattering method” (hereinafter referred to as the laser diffraction method), by which a relatively wide range of particle sizes can be measured.
Outline of particle size distribution analyzer with laser diffraction
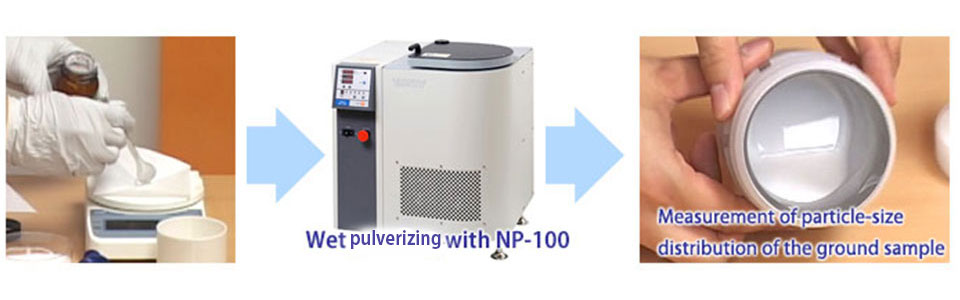
After wet grinding of a sample using NP-100, the particle size distribution is measured by the laser diffraction method.
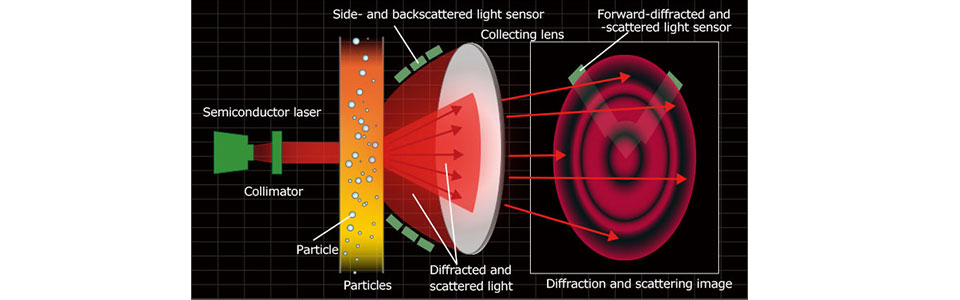
Laser diffraction method
In this method, the sample is irradiated by laser light and the particle-size distribution of the sample is determined from the intensity pattern of diffracted and scattered light. It is necessary to compare the scattering patterns of both theoretical and measured results in the process of determining the particle-size distribution. Therefore, the refractive index of the solvent and that of the sample are required for the measurement. Please provide the information on these refractive indices at the time of requesting the grinding test.
How to analyze results of particle-size distribution measurement
The results of actual measurement of the particle sizes of a sample are as follows.

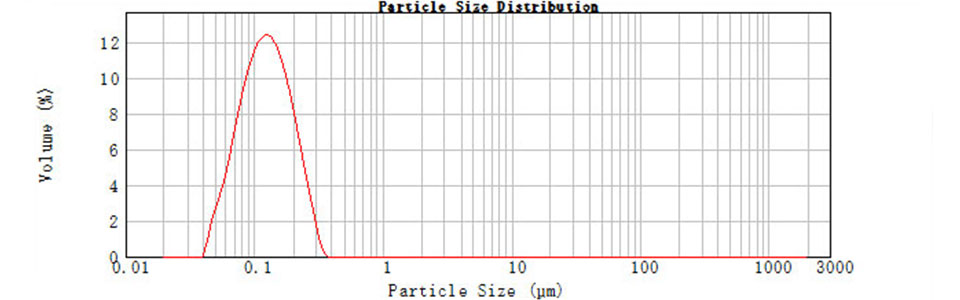
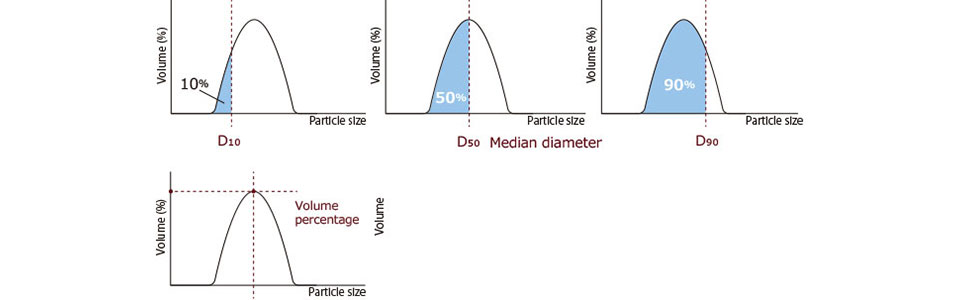
In the laser diffraction method, “D10”, “D50”, “D90” (horizontal axis) and “volume percentage (Volume (%))” (vertical axis) indicate the following values.
D10: The portion of particles with diameters smaller than this value is 10%
D50: The portions of particles with diameters smaller and larger than this value are 50%. Also known as the median diameter.
D90: The portion of particles with diameters below this value is 90%.
Volume percentage: The highest volume percentage of the particle size distribution displayed.
Next, the results for samples ground using three types of zirconia balls with diameters of 0.1, 0.3, and 0.5 mm are shown.
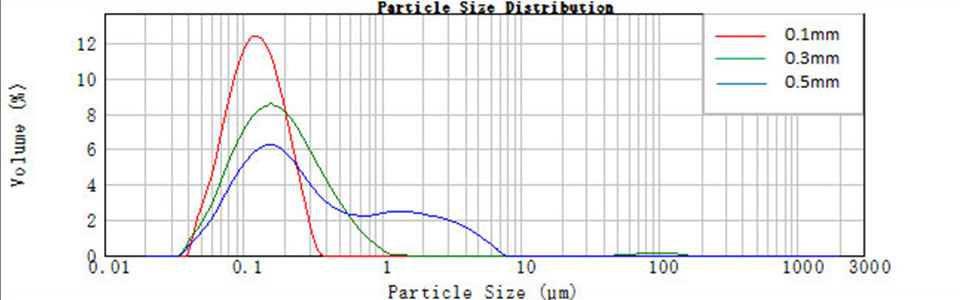
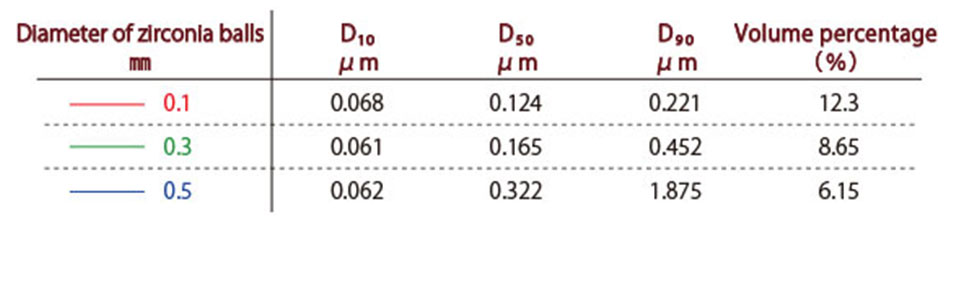
The above graph and the table show that D50 is approximately constant, but D90 and the volume percentage (%) are quite different from each other. The results clearly show that the crushed sample has smaller particle sizes and a sharper size distribution when smaller diameter zirconia balls are used. In this way, it is possible to select the appropriate parameters for grinding such that the resulting particle diameters become small and almost uniform.
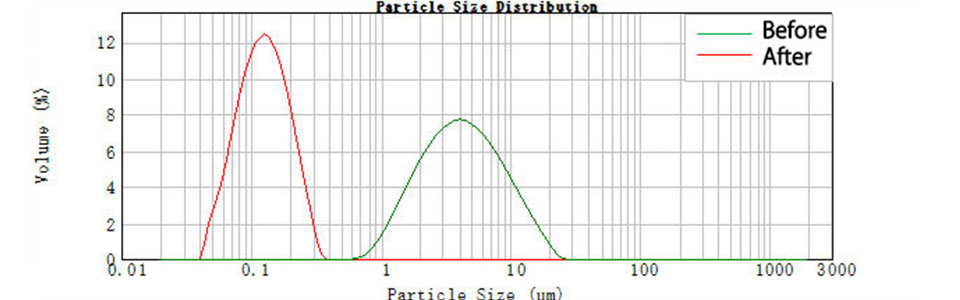
The particle-size distributions before (original powder) and after grinding (recommended recipe) are compared to obtain the final data.